The platform
Everything you can track, in one place
From airline agreements and policy compliance to hotel attachment, traveller safety and the performance of your whole book of business — the reporting you put in front of your clients, and the insight you run your agency on.
Airline agreement tracking
Hold airlines to their agreements — on your terms
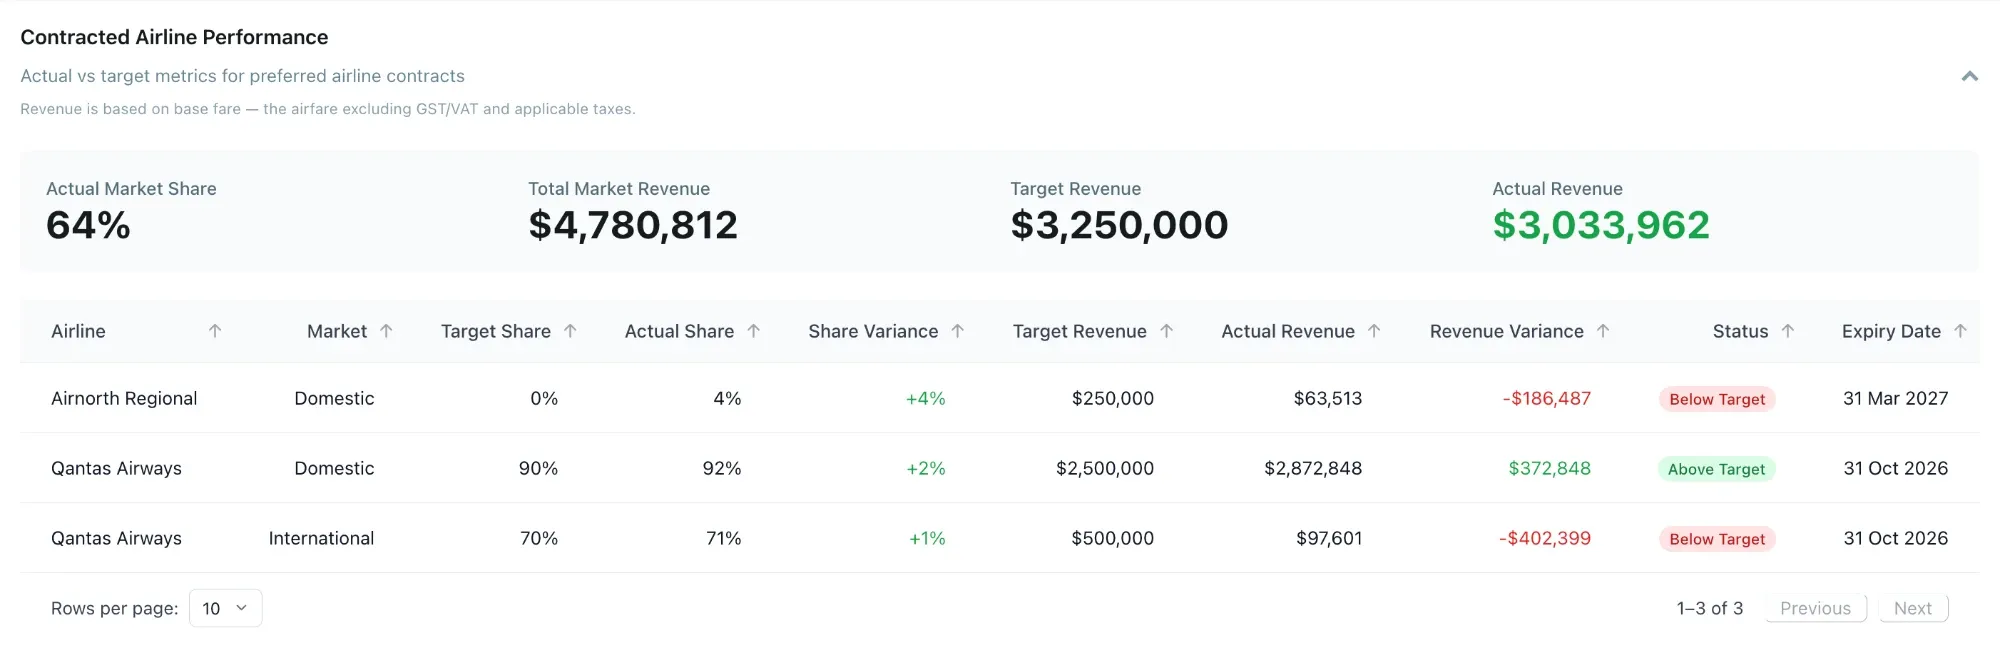
Track every airline agreement independently of the airline’s own reporting. Travel Analytics measures each deal from your clients’ actual flown tickets — using base fare, with taxes and surcharges stripped out — and reports market share against the targets the agreement was written on.
So your clients can see exactly how an agreement is really performing, and where non-compliance is quietly eroding the deal — on numbers they own, not the ones the airline chooses to show them.
Managing non-compliance
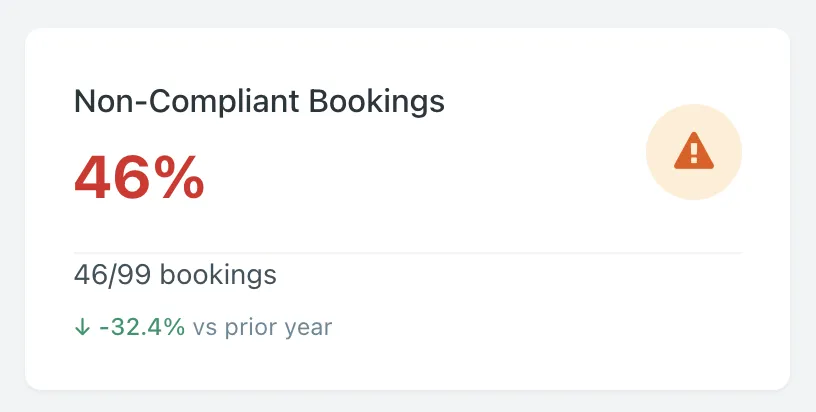
Put a number on non-compliance — and trace it to its source
Non-compliance isn’t a single figure. Travel Analytics brings its real cost together in one place, so your clients can see what breaking policy is actually worth:
- Lost savings — the negotiated fares and rates travellers didn’t take.
- Cost of change — what amendments, cancellations and rebookings are adding.
- Non-preferred suppliers — spend going outside the programme.
Review it across the whole organisation, then drill into any business unit or individual traveller to see exactly where compliance is slipping — and give clients the specifics they need to put it right.
Hotel attachment
Find the trips with no hotel — and the deals worth doing
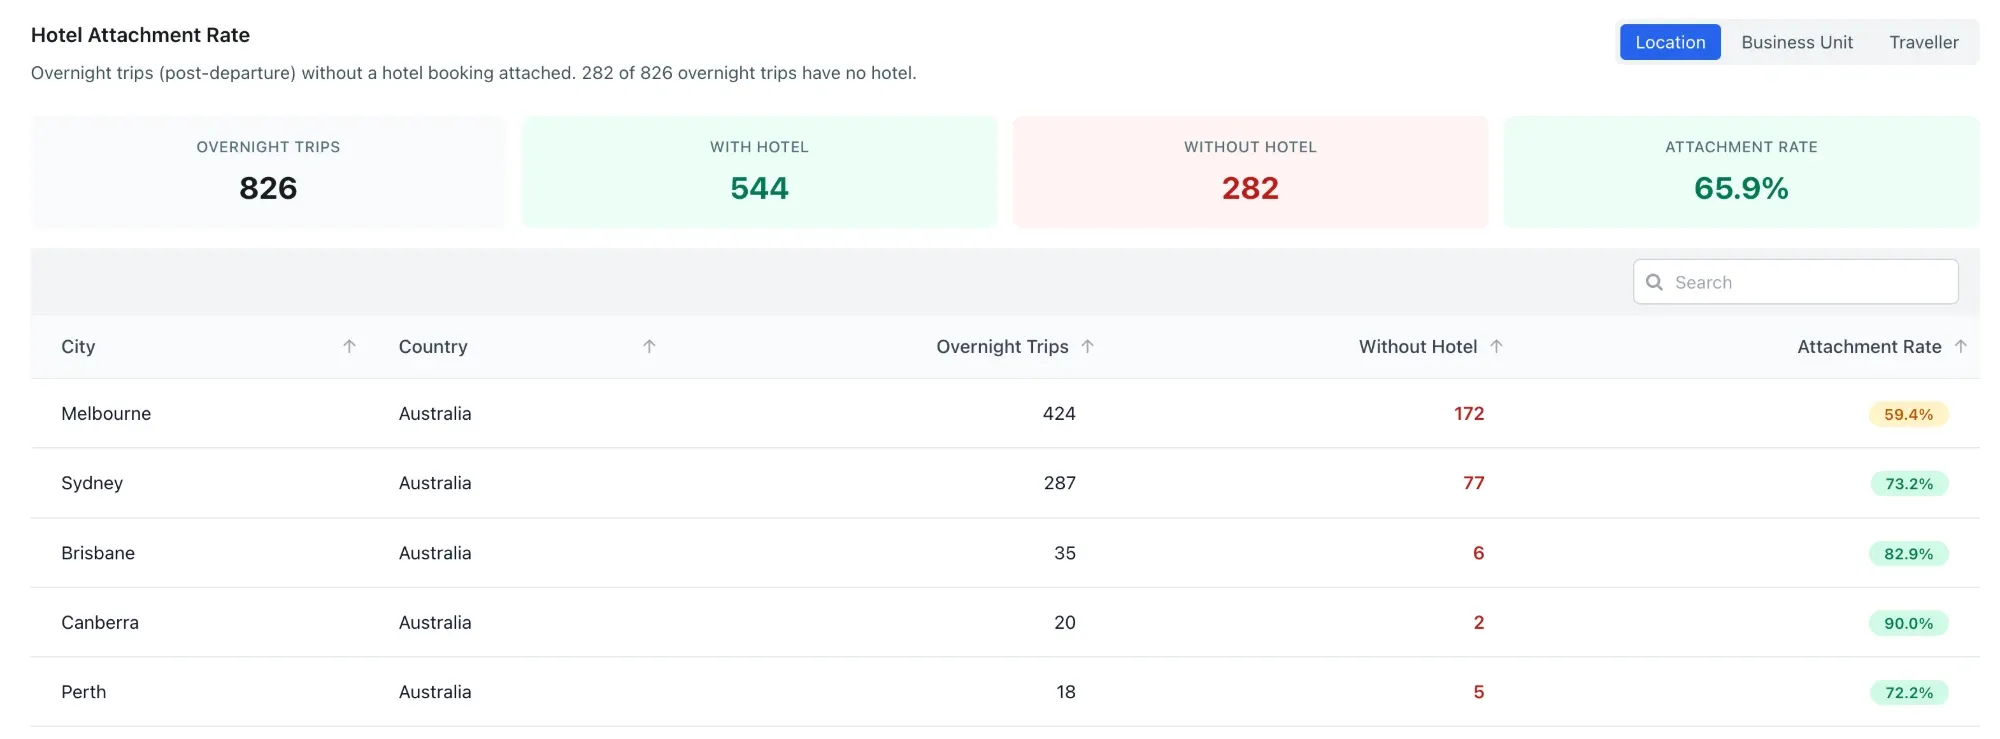
Every overnight trip booked without a hotel is revenue and visibility walking out the door. Travel Analytics measures hotel attachment for destinations the world over, so your clients can see where travellers are booking rooms elsewhere — by city, business unit or individual traveller.
It’s how you check compliance to preferred hotels, focus on the high-volume locations where attachment matters most, and spot the cities where there’s enough demand to put a new supplier agreement on the table.
Traveller tracking
Know where every traveller is — before you need to
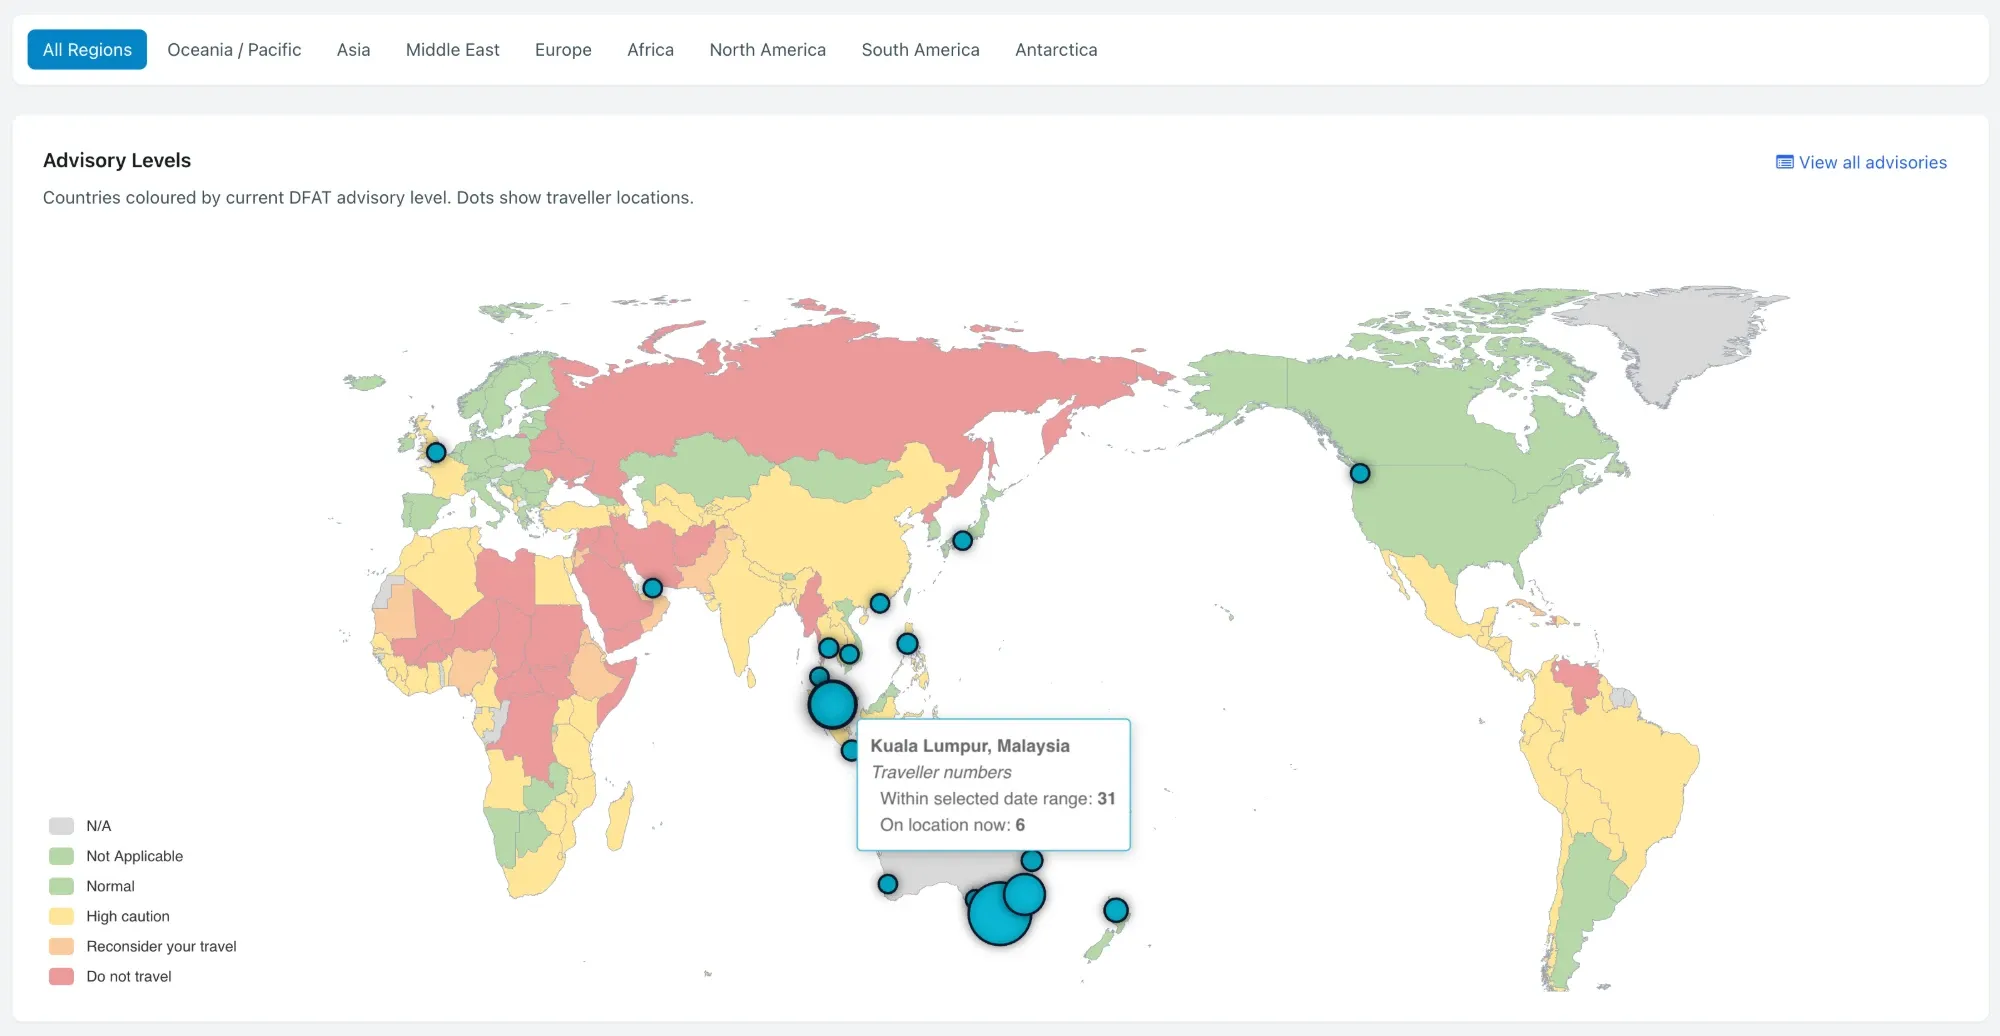
When something happens — severe weather, unrest, a health scare — your clients need to know who’s there, right now. Travel Analytics plots every traveller against live DFAT advisory levels, so a glance at the map shows who’s in a high-risk location and how many are on the ground.
Drill into any traveller’s bookings to see where they’ve been and where they’re heading next — so your clients can meet their duty of care, and reach the right people fast.
Performance across the business
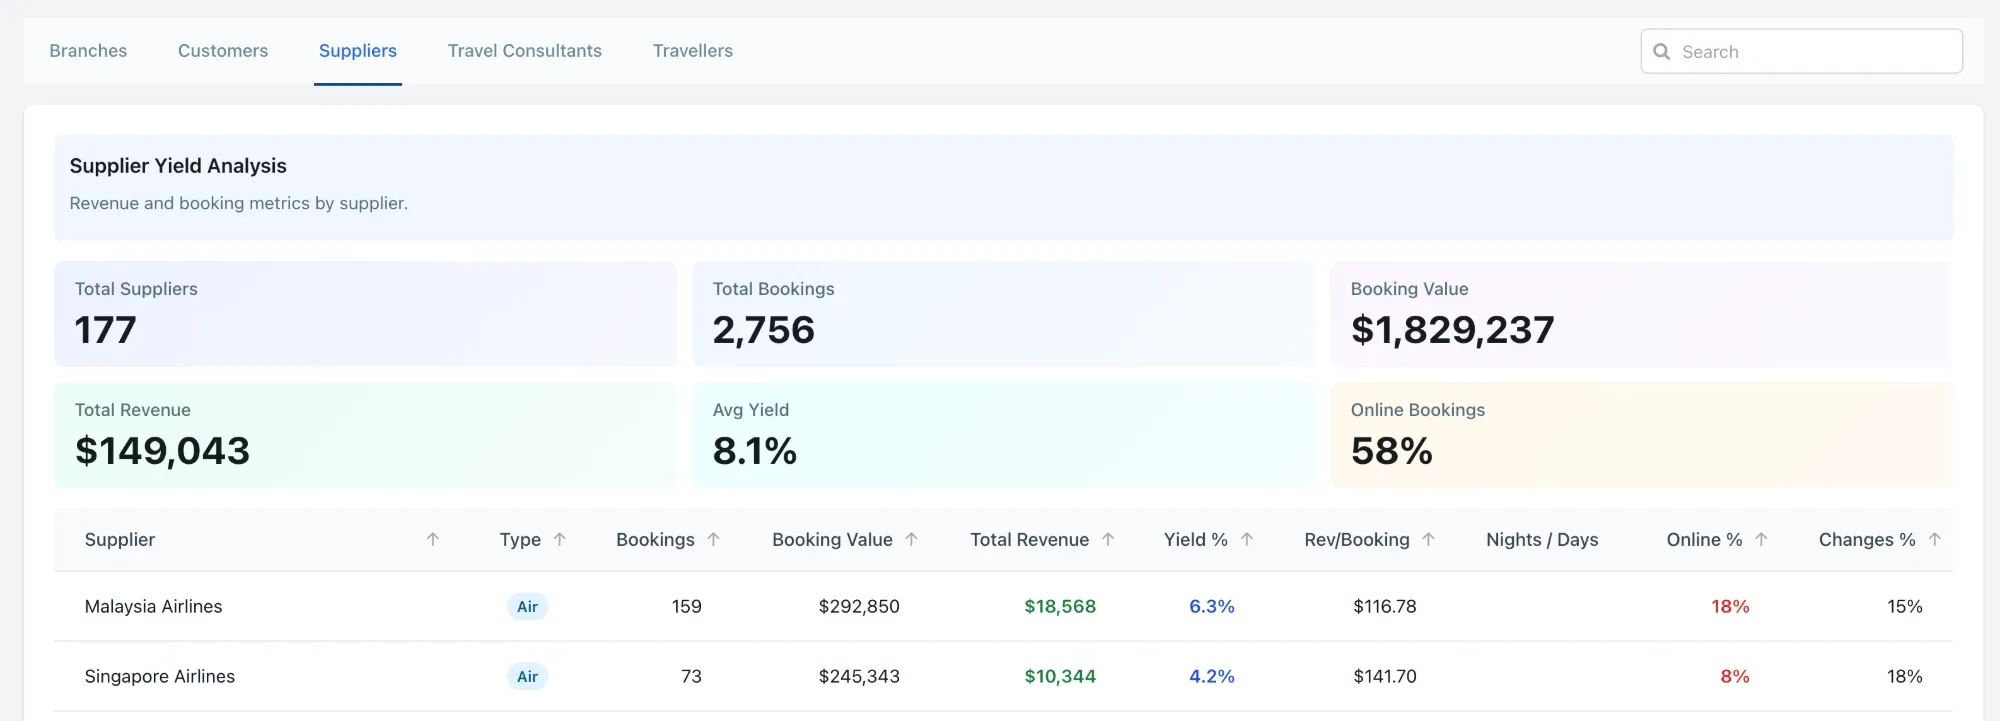
See how every part of the book is performing
Track contractual and resource performance across branches, customers, suppliers, travel consultants and individual travellers — revenue, yield, booking value and online adoption, all in the same view.
It’s not just reporting for your clients — it’s the insight you run your agency on: where the margin is, which relationships are working, and where the opportunities to improve are hiding.